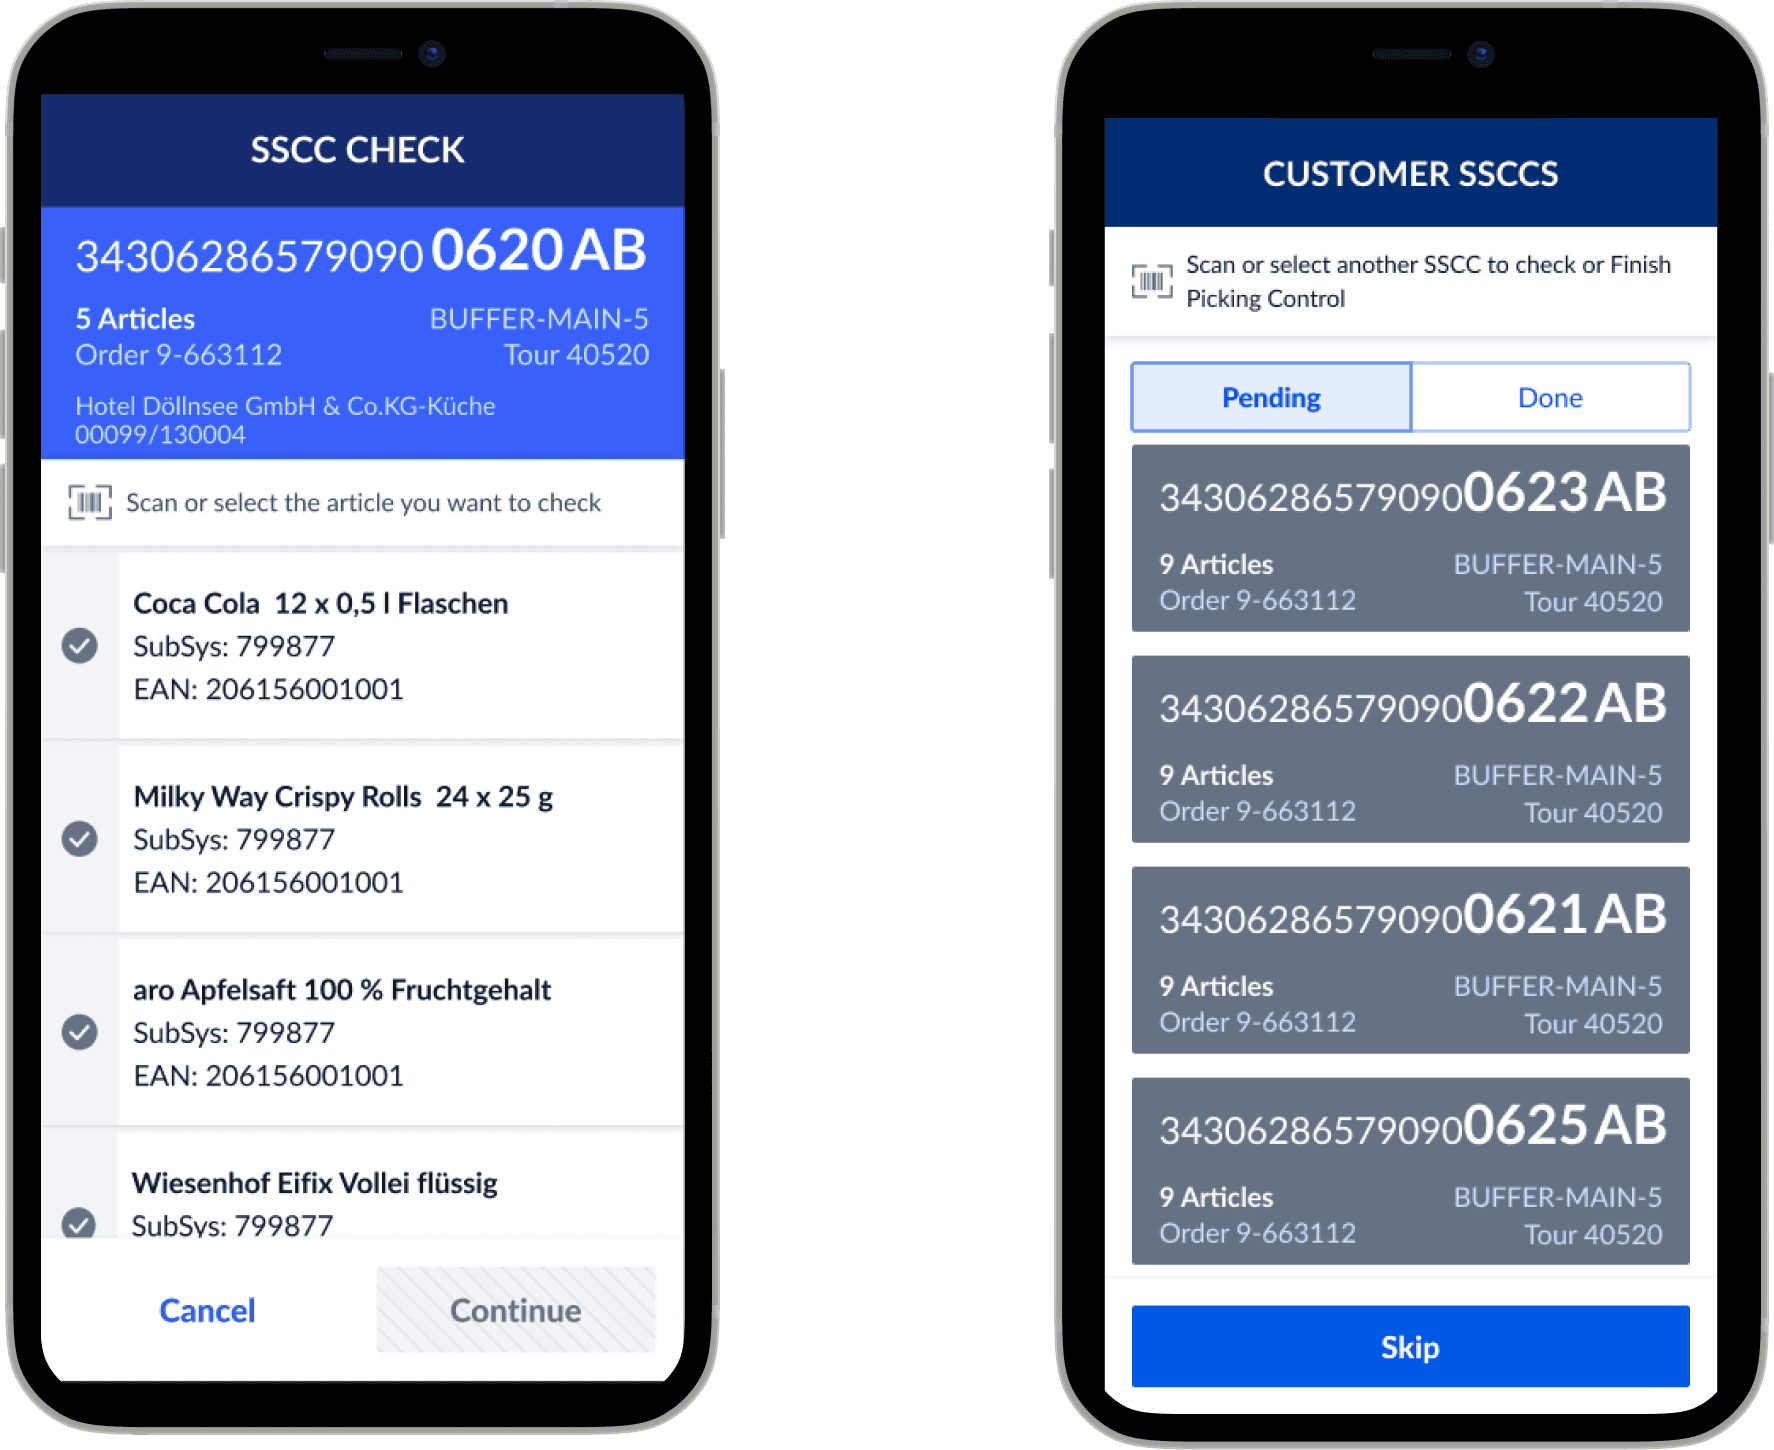
Redesign & New Functionalities: Quality Control Mobile App

Redesign and enhance the Quality Control Mobile App with new features for improved usability and efficiency.

Role

UX/UI Designer

Industry

Wholesale

Team

Cross-functional

Overview

I designed a Picking Control tool that reduces errors, improves operational workflows, and restores customer trust. The tool provides supervisors with actionable insights, empower pickers with real-time feedback, and aligns processes across all METRO countries.

Enhancing Picking Control

After uncovering the challenges of the old version of the Picking Control tool and gathering valuable insights from surveys, workshops, and stakeholder alignments, the goal was clear: to design a tool that not only resolved inefficiencies but also empowered supervisors and teams with actionable insights, all while aligning with METRO’s overarching business objectives.

  1. Survey

The survey was crafted to capture stakeholders' perspectives on process workflows, tool functionality, and organizational goals. Questions were designed to gather insights into system inefficiencies and gather strategic feedback on potential improvements

Responses were systematically grouped into categories such as operational challenges, strategic misalignments, and functionality gaps. Stakeholder-specific insights were analyzed to ensure diverse perspectives were captured and synthesized.

  1. Stakeholders Workshop

Following the survey, a workshop was organized to validate the findings and dive deeper into the identified issues.

This was an important step in the discovery process, where we collaborated with representatives from all participating METRO countries to define a standardized Picking Control process.

This session provided a structured platform for brainstorming, aligning perspectives, and addressing key challenges identified during the initial stakeholder survey. Our primary achievements included not only defining a unified process but also establishing a roadmap with short-term and long-term goals to ensure continuous improvement and process alignment across regions.

Jobs to be done

I included JTBD after the research and before usability testing to make sure my design solutions are based on real user needs. This way, the tool becomes more effective and user-friendly.

Problem definition

Small picking mistakes led to an 18% return rate, with 58% caused by errors. This cost METRO trust, €45M in lost sales, and rising operational inefficiencies. Beyond finances, it impacted customers' loyalty and warehouse teams’ efficiency, highlighting the urgent need for change.

Moderated Usability Testing

Developed a test plan and documented task execution results. Usability testing sessions took place in Dusseldorf (Germany) and Warsaw (Poland), involving 12 participants. The prototype designed in Figma was tested on both a Zebra device and an iPhone. 

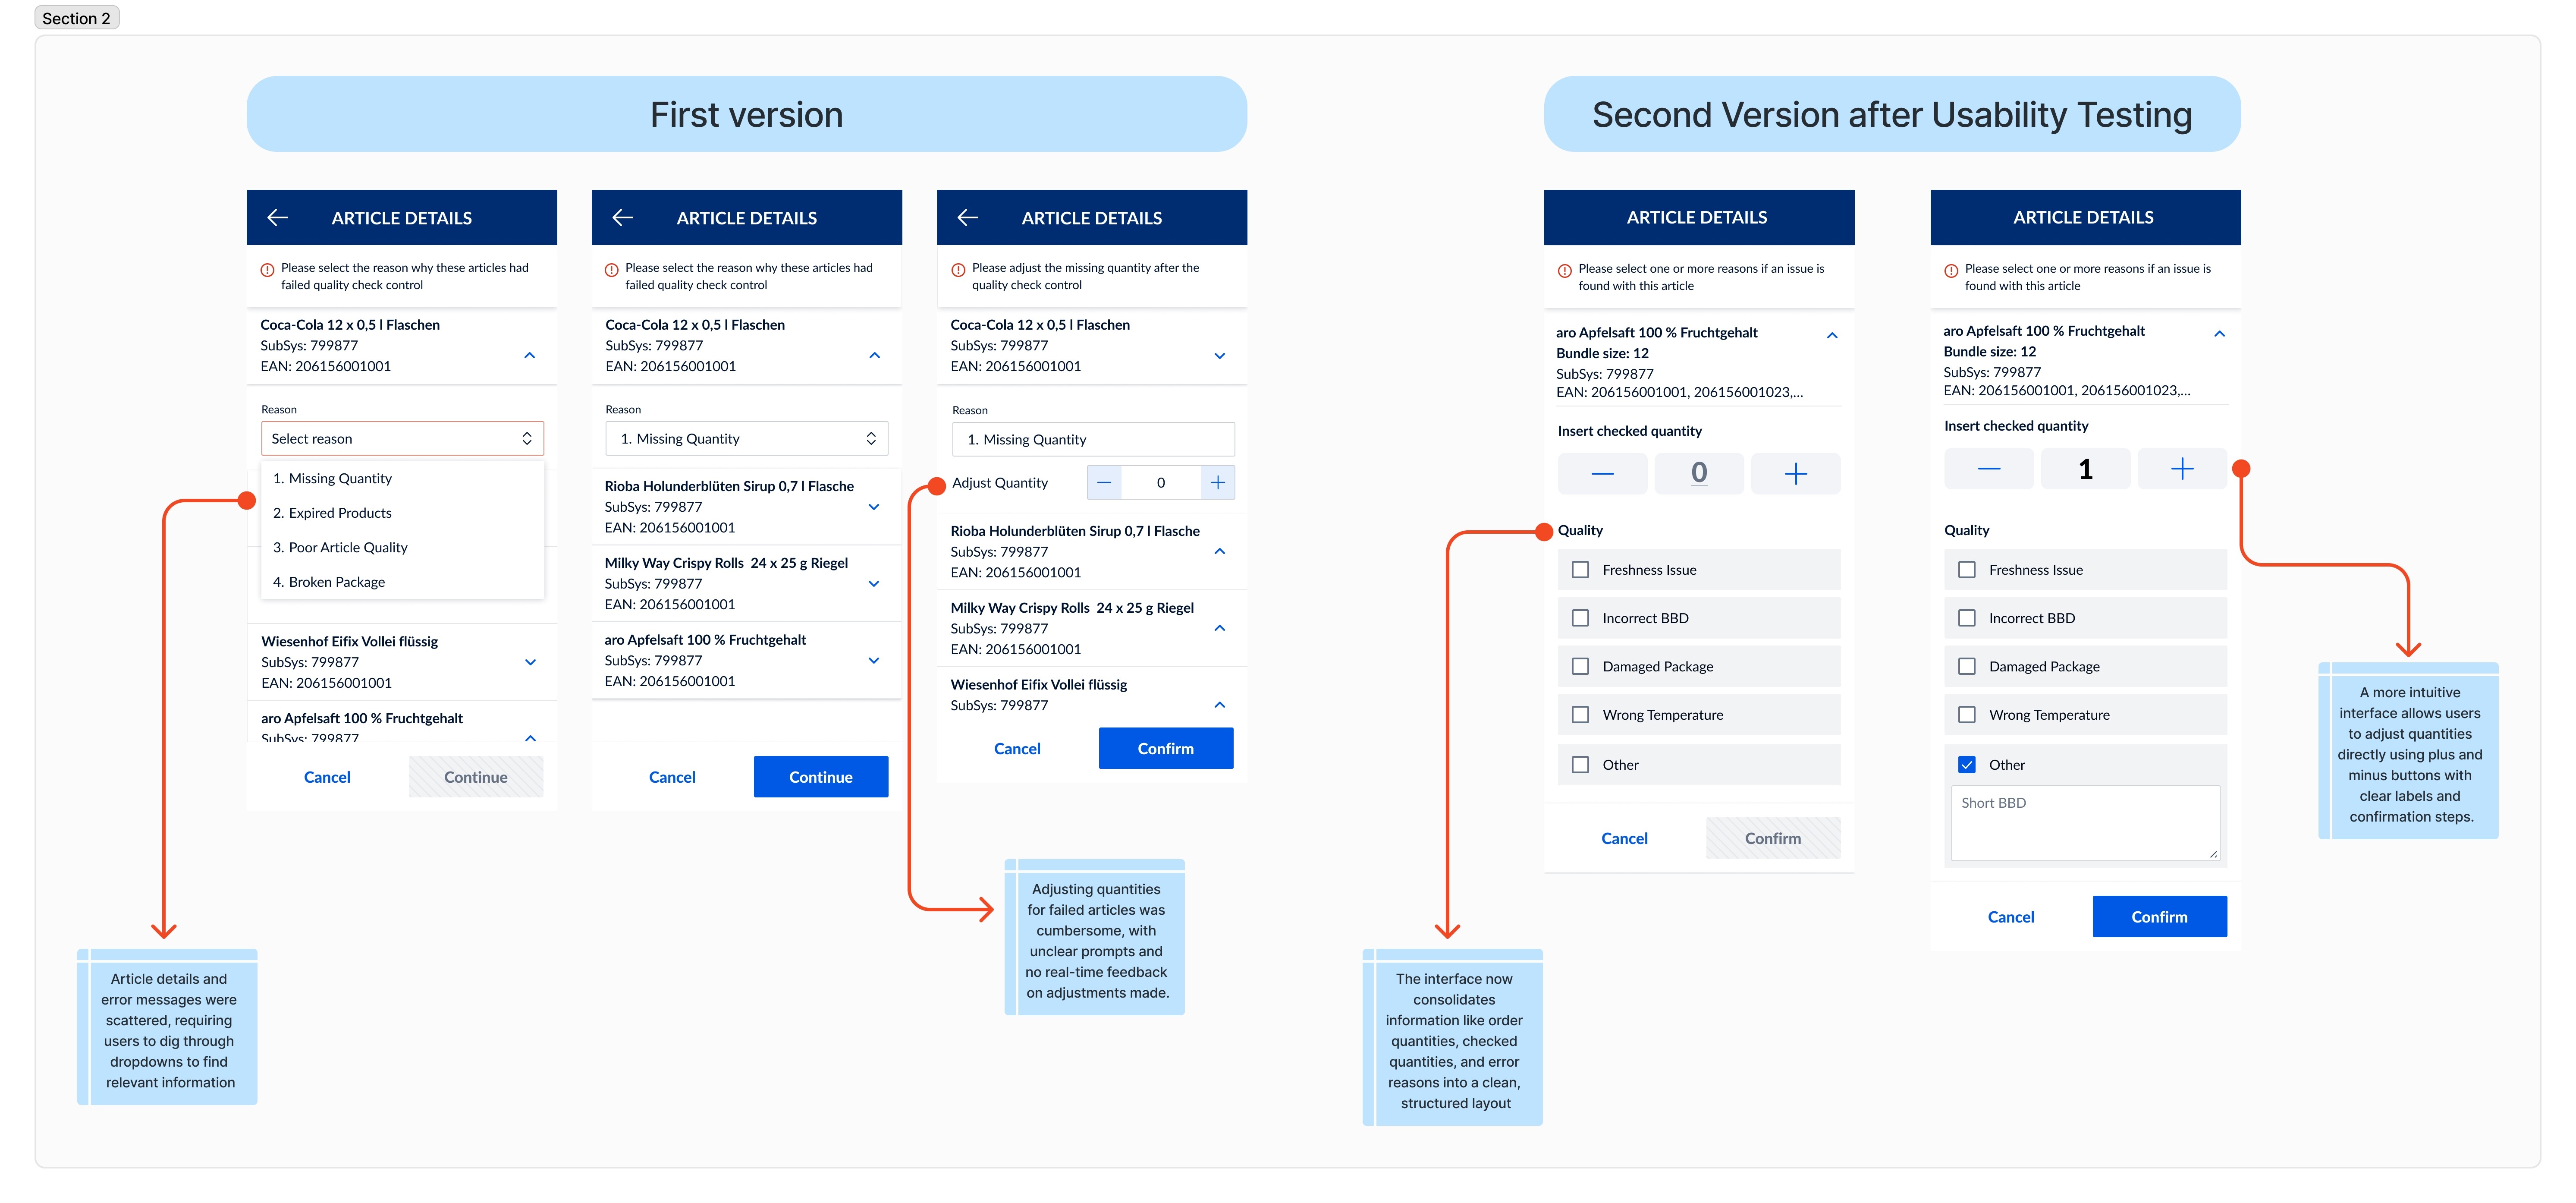
Pilot in Poland and Germany part 1

The first iteration of the enhanced Picking Control tool was tested in two key markets: Poland and Germany. These countries were chosen as pilot locations due to their operational scale and diverse use cases, making them ideal environments to assess the tool’s impact.

Conclusions after the first Usability Testing

The results of the first usability testing highlighted several critical areas requiring improvement to enhance the effectiveness and user-friendliness of the Picking Control tool. While the initial version provided a functional baseline, the testing revealed significant gaps that hindered user performance and satisfaction:
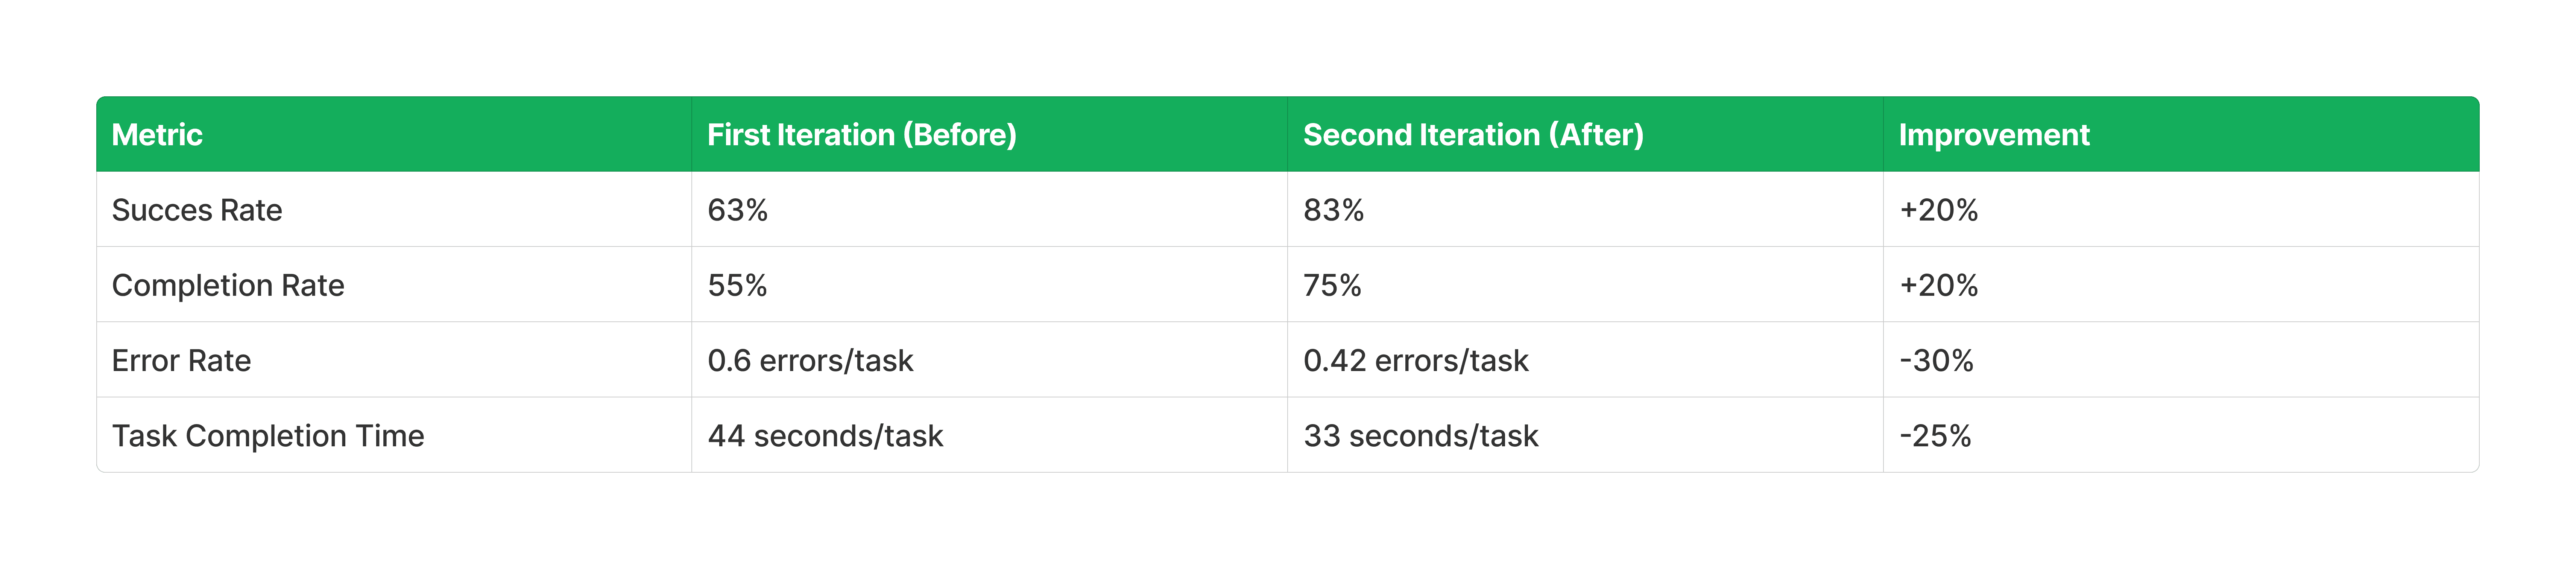
Key Findings:

Low Success and Completion Rates:

Only 63% of users successfully completed tasks, and 55% of participants finished all assigned tasks. These numbers pointed to challenges in navigation, unclear workflows, and insufficient guidance during error resolution.


High Error Rate:

An average error rate of 0.6 errors per task indicated confusion during key processes such as quantity adjustments, identifying reasons for failed articles, and navigating between tasks. This error rate underscored the need for more intuitive interfaces and better feedback mechanisms.


Slow Task Completion Time:

A median task completion time of 44 seconds suggested inefficiencies in the workflow and overly complex steps, particularly for resolving errors and confirming adjustments.

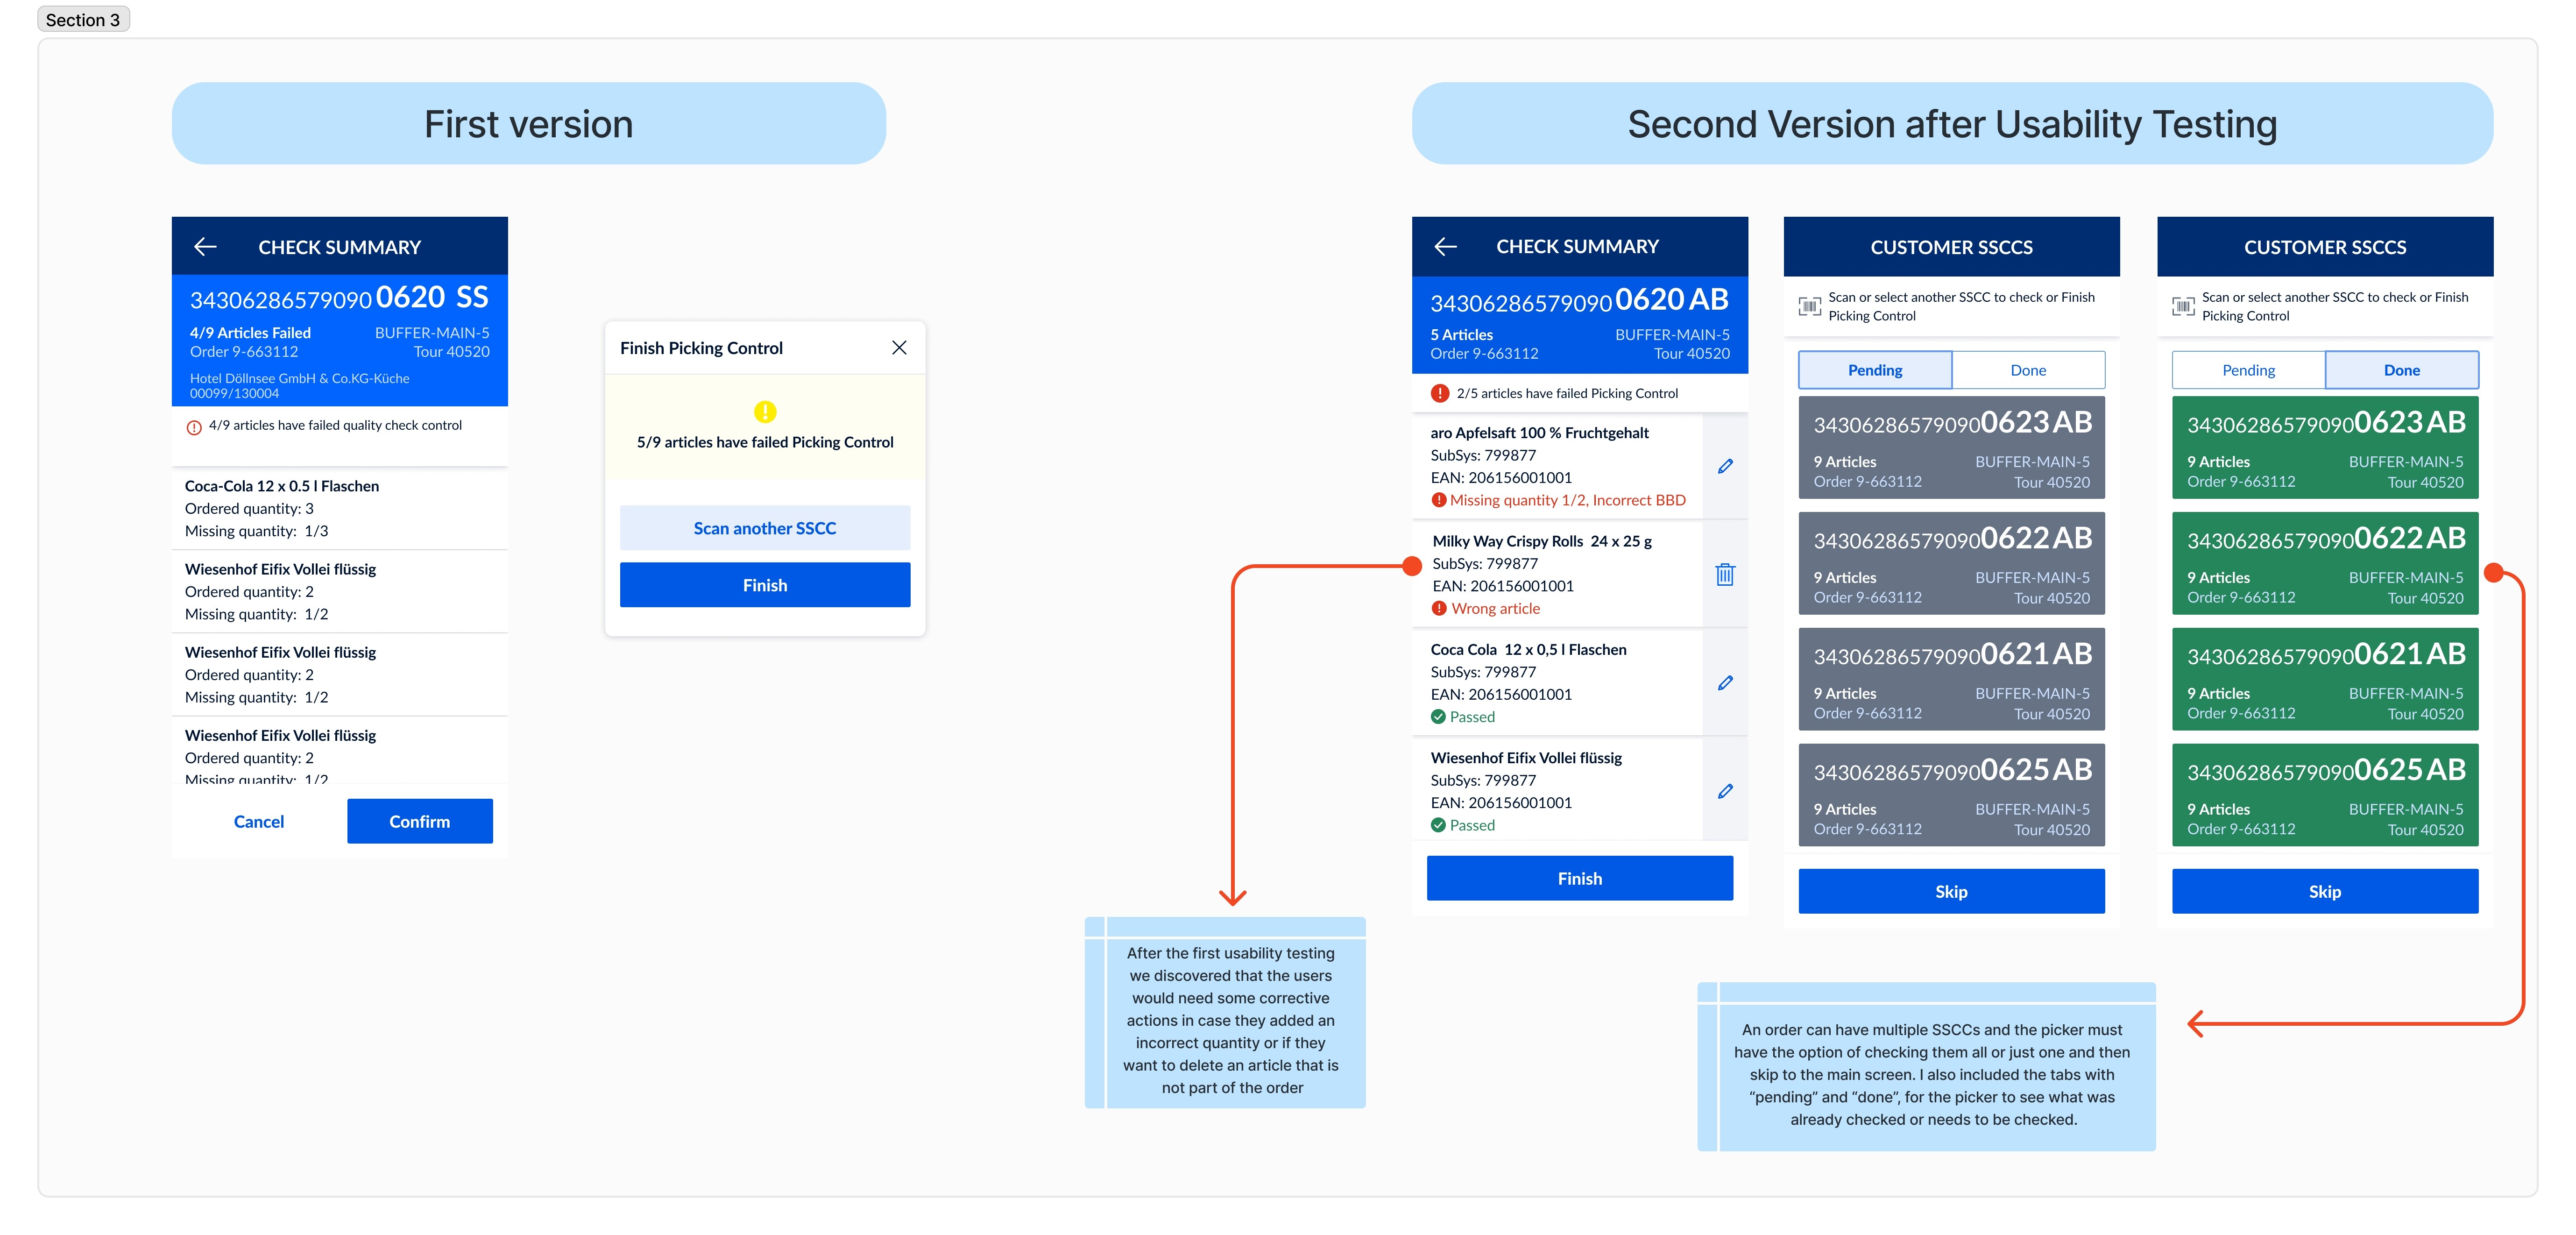
Pilot in Poland and Germany part 2

After conducting another round of usability testing with the enhanced prototype in the same two countries, Poland and Germany, I gathered valuable insights. This second round of testing allowed me to evaluate the impact of the improvements made after the first iteration, revealing how the adjustments addressed previous challenges while uncovering new areas for further refinement.

Improvements and their impact

The improvements to the Picking Control tool after usability testing not only addressed user pain points but also streamlined workflows, reduced error rates, and increased user confidence in the system. These changes are expected to have a direct impact on operational efficiency, picker performance, and overall customer satisfaction.

Monitoring

CSAT (Customer Satisfaction Survey)

Before starting the prototype for the enhanced Picking Control tool, I conducted a Customer Satisfaction (CSAT) survey to evaluate the performance of the existing version. The goal was to gather quantitative and qualitative data on how users interacted with the current system, identify pain points, and use these insights as the foundation for designing the prototype.

Objectives of the CSAT Survey

  • Measure user satisfaction with the current Picking Control tool.

  • Identify specific pain points and limitations impacting user experience and operational efficiency.

  • Gather baseline metrics for comparison against future iterations of the tool.

  • Understand how the tool supported or hindered users in achieving their tasks, especially across different roles like pickers and supervisors.

Key Metrics Captured

  • Overall Satisfaction: Quantitative scores reflecting how satisfied users were with the tool’s performance.

  • Feature-Specific Ratings: Insights into which features (e.g., error handling, task navigation) were functional and which were problematic.

  • Ease of Use: Ratings on how intuitive the tool was and whether users felt supported by its design.

  • Pain Points: Specific challenges or frustrations users faced when trying to complete their tasks, such as unclear instructions or lack of actionable feedback.

  • Suggestions for Improvement: Open-ended feedback that provided detailed insights into user needs and expectations.


Google Analytics 4


Outcomes

The final version of the Picking Control tool successfully addressed the challenges identified in earlier iterations, delivering a robust and user-friendly solution that balances operational efficiency with user needs. Here are the key takeaways:

Significant Improvement in Usability

  • Success Rate: Increased to 83%, demonstrating a clear enhancement in users’ ability to complete tasks accurately.

  • Completion Rate: Improved to 75%, indicating a smoother workflow and fewer obstacles during task execution.

  • Error Rate: Reduced to 0.42 errors per task, showcasing the effectiveness of real-time feedback and intuitive design in minimizing mistakes.

  • Task Efficiency: Task completion time decreased to a median of 33 seconds, highlighting the streamlined workflows and simplified interactions.

Enhanced User Experience

  • For Pickers: Real-time error feedback, clear task guidance, and simplified quantity adjustment workflows empowered users to resolve issues confidently and independently.

  • For Supervisors: Detailed insights into reasons for failures, standardized reporting, and actionable data enabled better oversight, coaching, and process optimization.

Operational Consistency Across Countries

  • The standardized Picking Control process proved effective in both Poland and Germany, showcasing its scalability and adaptability to diverse operational contexts.

  • The solution struck a balance between global standardization and regional flexibility, ensuring consistent quality control while addressing local needs.

Positive Business Impact

  • Reduced return ratios and error rates translated into fewer operational inefficiencies, helping to recover significant revenue lost due to returns.

  • Streamlined processes improved overall productivity, reducing manual effort and time spent on resolving issues.

  • The improved tool restored customer trust by ensuring more accurate order fulfillment, contributing to increased satisfaction and loyalty.

Lessons learned

Designing a quality control mobile app from scratch was a journey full of insights.

  • One key lesson was the power of collaboration—workshops with stakeholders revealed pain points we hadn’t initially considered, proving that great design starts with listening.

  • Another big takeaway was the importance of iteration. What seemed like a solid prototype often evolved after real-world testing, reinforcing that user needs should always drive design, not assumptions.

  • Lastly, I learned that balancing business goals with user experience is an art—making something functional isn’t enough; it has to be intuitive and truly solve problems.


Other projects

Andreea Mahalean

Copyright 2025 by Andreea Mahalean

Andreea Mahalean

Copyright 2025 by Andreea Mahalean

Andreea Mahalean

Copyright 2025 by Andreea Mahalean